Resources
In November 2015, the Marine Biodiversity Center was charged with creating an initial analysis of collections climate standards that should be met, and the current status of collections rooms (based on room size and climate measurements):
Collections climate standards [revision of 2016 October]
Status of collection rooms [revision of 2015 November]
Detailed recommendations on collections climate control can be found in:
Image Permanence Institute (2012) Sustainable Preservation Practices.
The Image Permanence Institute distributes a handy two-page flyer covering key environmental management topics for collections management.
NHM current and historical data
Click a thumbnail to go to the full-size chart. Click on any full-size chart for a high-resolution PDF version, suitable for printing.
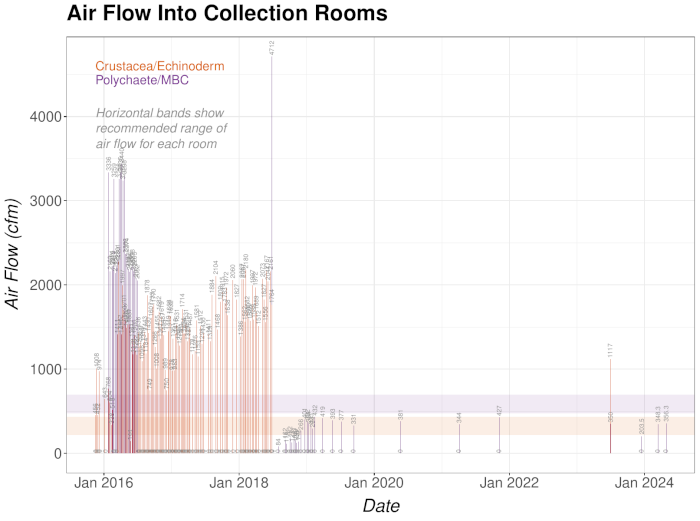
Air flow
Air flow is measured by MBC staff on a weekly basis. An AAB ABM 200 anemometer is used to traverse every duct in each room. Based on the duct size, flow rate (in cubic feet per minute, cfm) is calculated for each duct. Total airflow for each room is the sum of all duct inflows.
How close to acceptable are we?
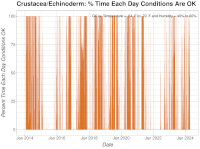
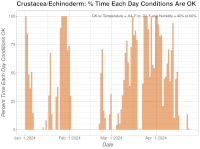
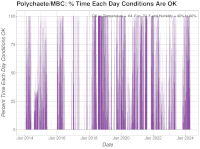
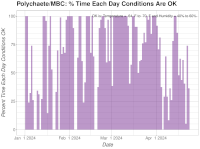
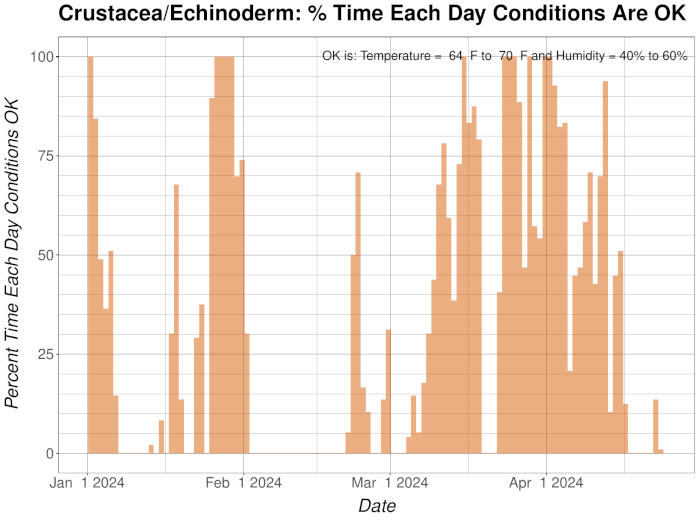
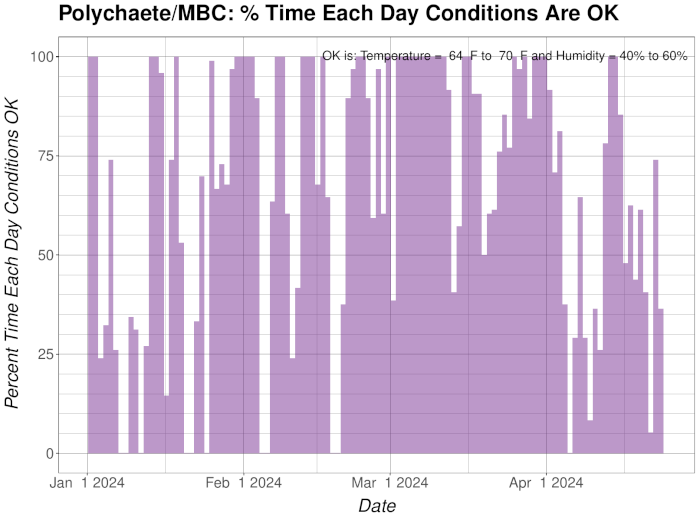
Air temperature and humidity are measured every 15 minutes (see below). Based on those measurements, and the climate standards appropriate for the collection spaces (see standards), the percent of time each day that the collection room climates are within an acceptable temperature range (67 F ±3) and humidity range (50% ±10) is calculated and graphed for the past few months, and since January 2014.
Last four months
Long term
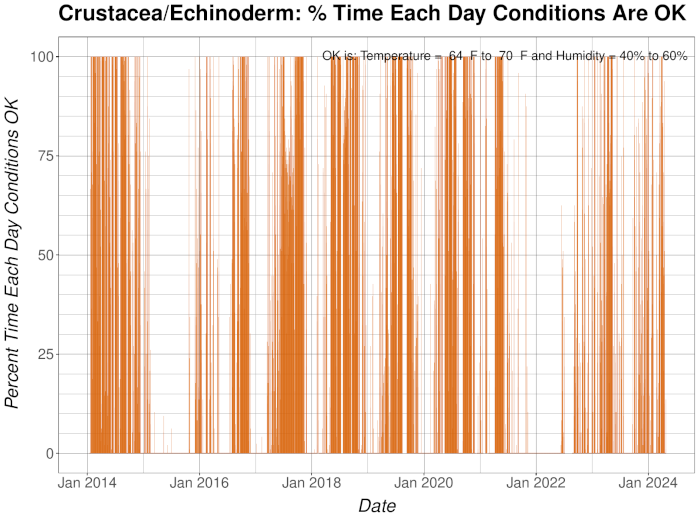
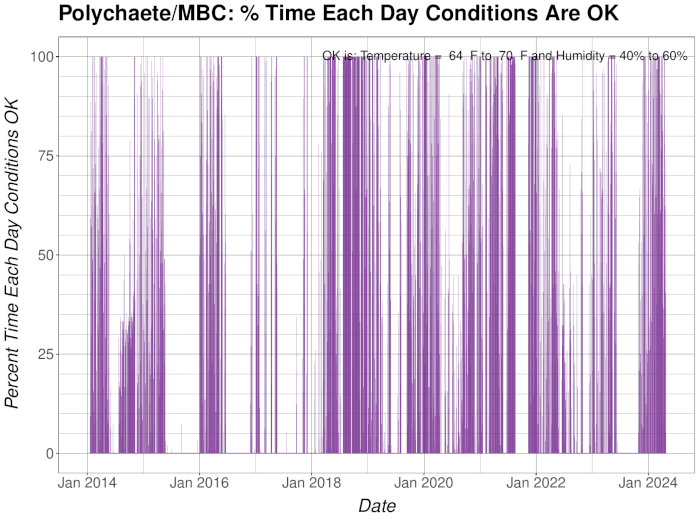
Detailed data
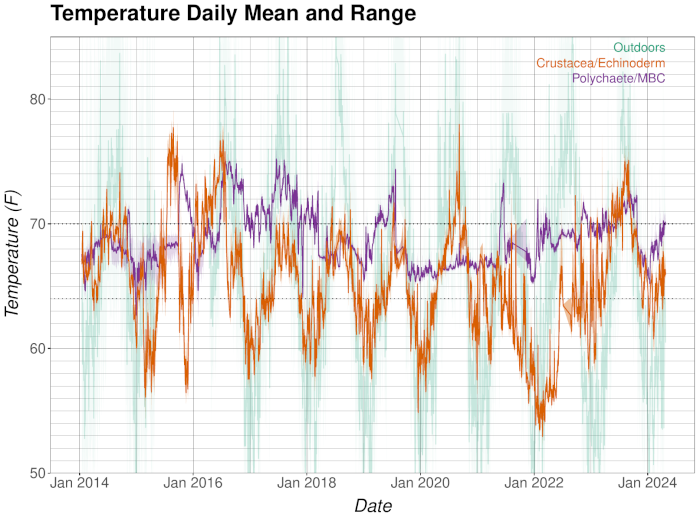
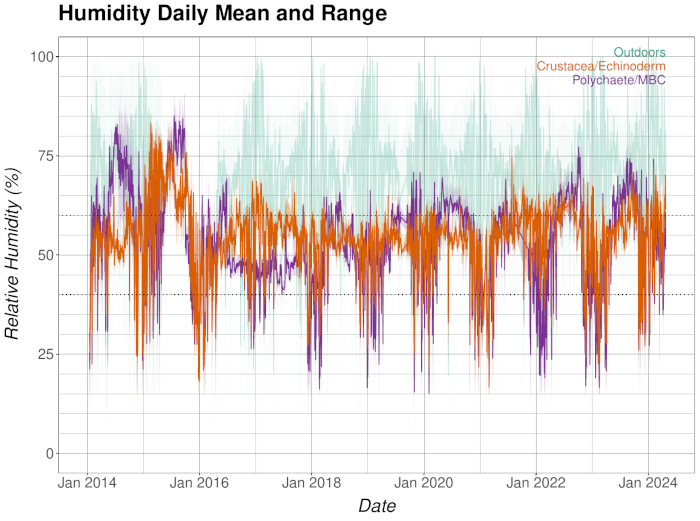
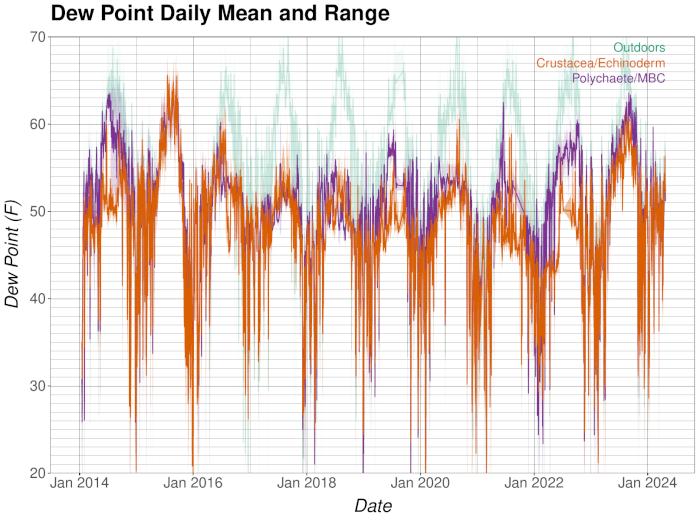
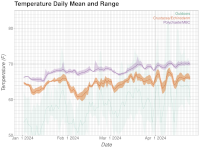
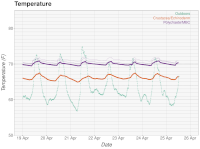
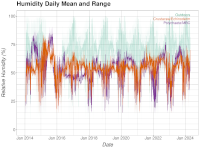
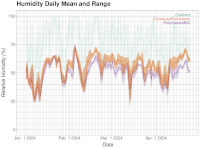
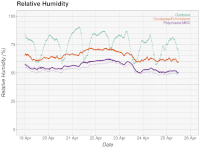
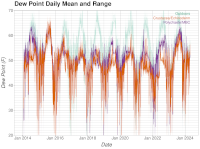
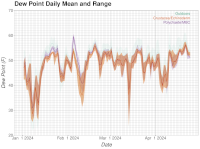
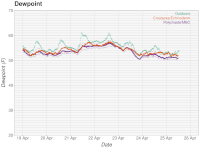
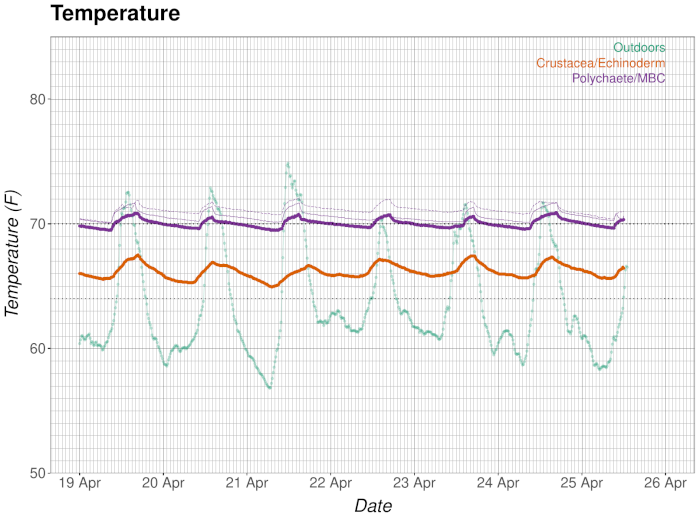
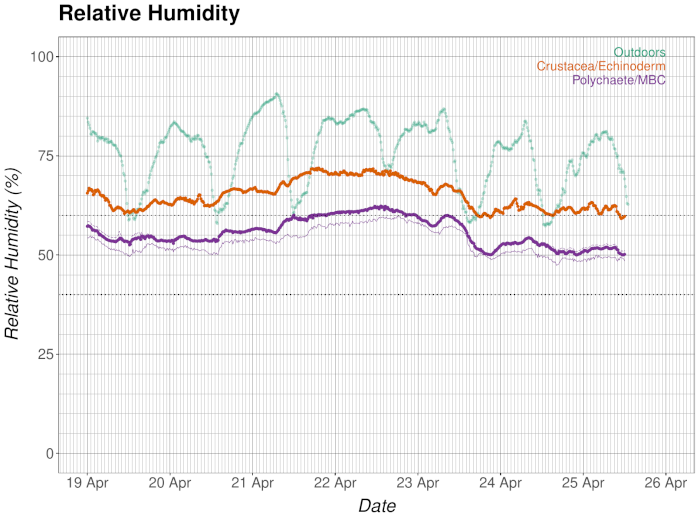
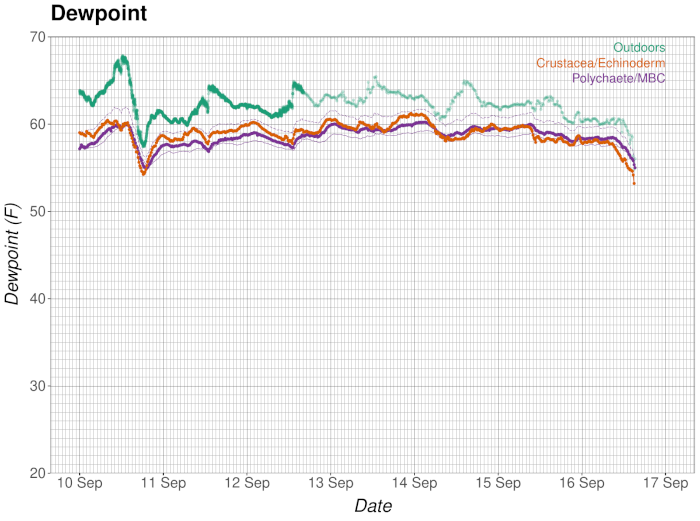
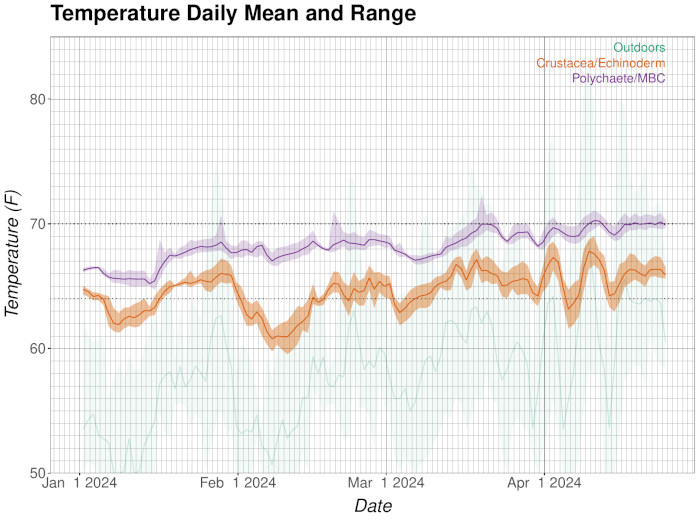
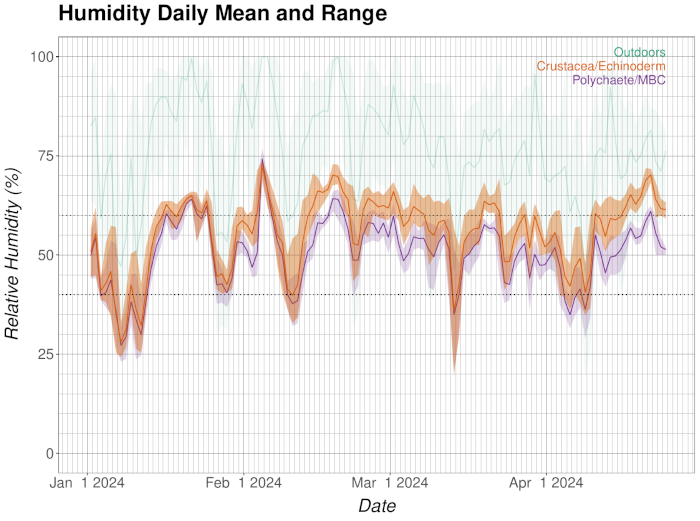
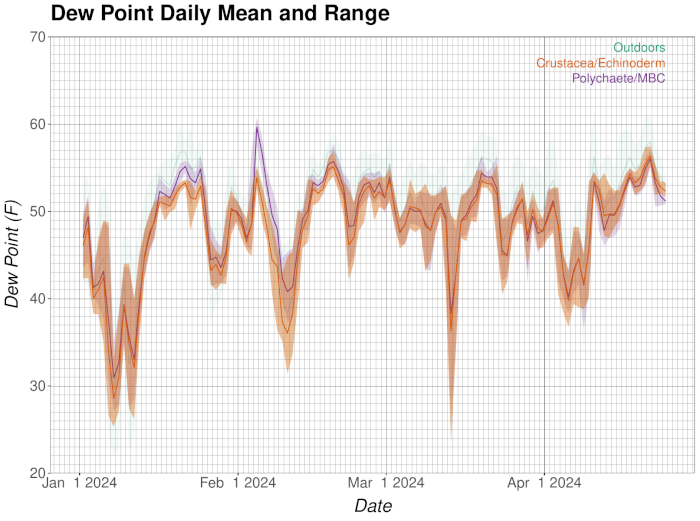
Indoor temperature and humidity are logged every 15 minutes using Onset UX100-003 data loggers. Until May 2015, outdoor temperature and humidity were measured using an Onset S-THB-M002 sensor and U30-NRC logger; beginning in May 2016, they were measured using an Onset MX1101 logger in an RS1 solar shield. Solid lines give the mean daily reading; the shaded bands show the daily range around the mean. Dotted horizontal lines show the acceptable limits, based on the appropriate standards (see standards). The upper charts show the datapoints for the most recent week, next is the summary for the past four months, and last are the long-term data since January 2014. Dew point is calculated from temperature and humidity, and is a measure of the absolute amount of water in the air.
Most recent week
Last four months
Long term
